Data & results
From archived photographs to digital elevation models, orthophotos, glacier outlines and related environmental applications.
From archived photographs to digital elevation models, orthophotos, glacier outlines and related environmental applications.
From the historical aerial photographs to orthophotos and the elevation model of the post-war Austrian Alpine Regions.
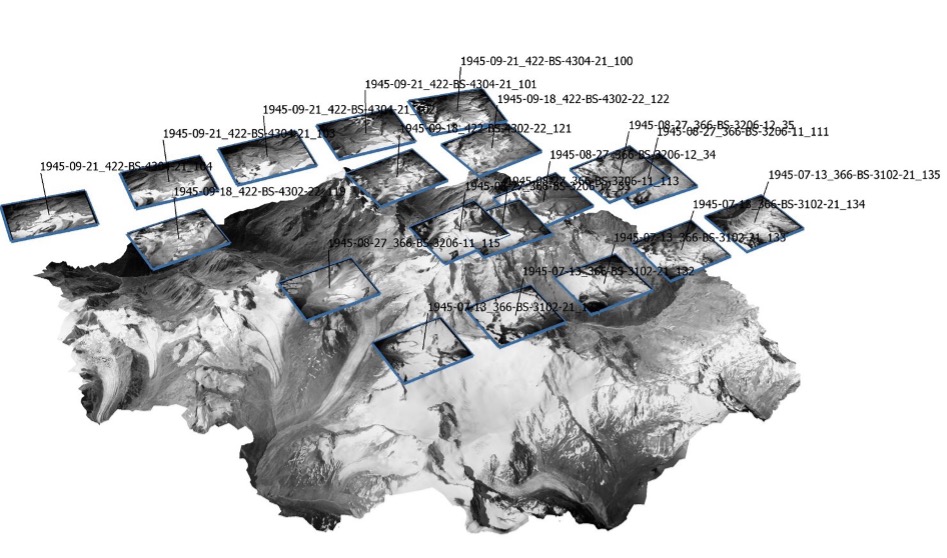
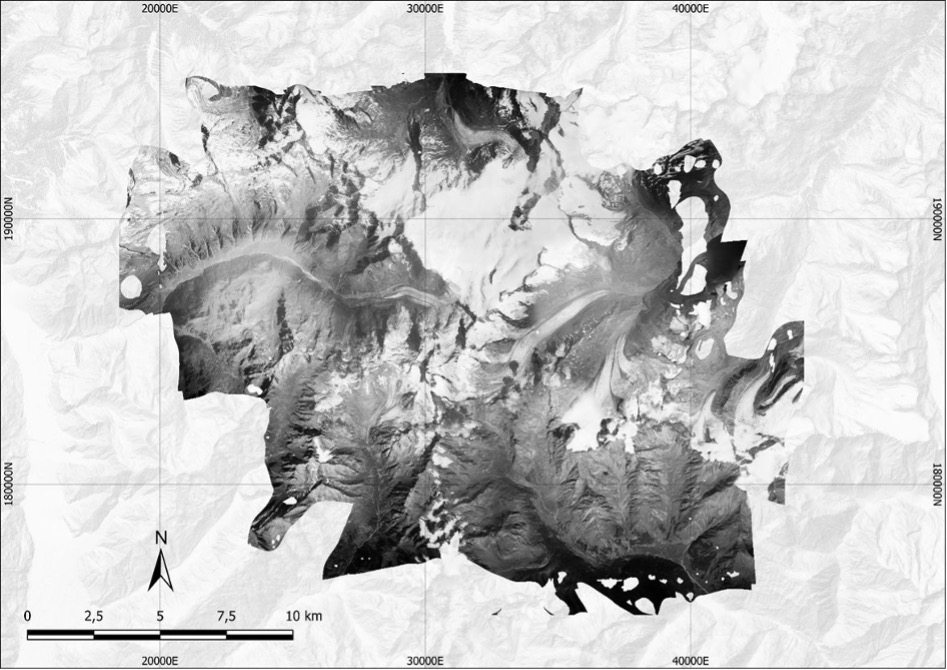
Overlapping aerial photographs are matched across several camera positions using Structure-from-Motion, which reconstructs the scene in 3D. From this we derive digital elevation models and orthophotos. Applying Structure-from-Motion to historical images is challenging, especially in glacierized Alpine regions. Steep terrain, strong contrast between sunlit snow and shadow, large snowfields with little texture, and film that has degraded over decades in archives build challenges for image matching. Our workflow builds on the Historical Structure-from-Motion approach of Knuth et al. (2023) and extends it in several ways. The scans are first corrected using a new technique for measuring the frequently distorted fiducials, and the image contrast is enhanced. Incorrect camera positions in the archive records are detected and corrected automatically. Camera and lens properties are estimated separately for each flight day, because film and scanning can differ between flights, while all images are still processed together as one block. The 3D model is then aligned step by step to a modern elevation model using only stable, ice-free terrain. Finally, terrain features matched between the historical and the modern surface are used as extra control points. These steps remove many remaining distortions, providing unique 3D data.
Feb, 2026
3D views of the reconstructed Alpine terrain
Pasterze, 1945 vs. today
Ötztal, 1945
Okt, 2026
Semi-automated glacier delineation
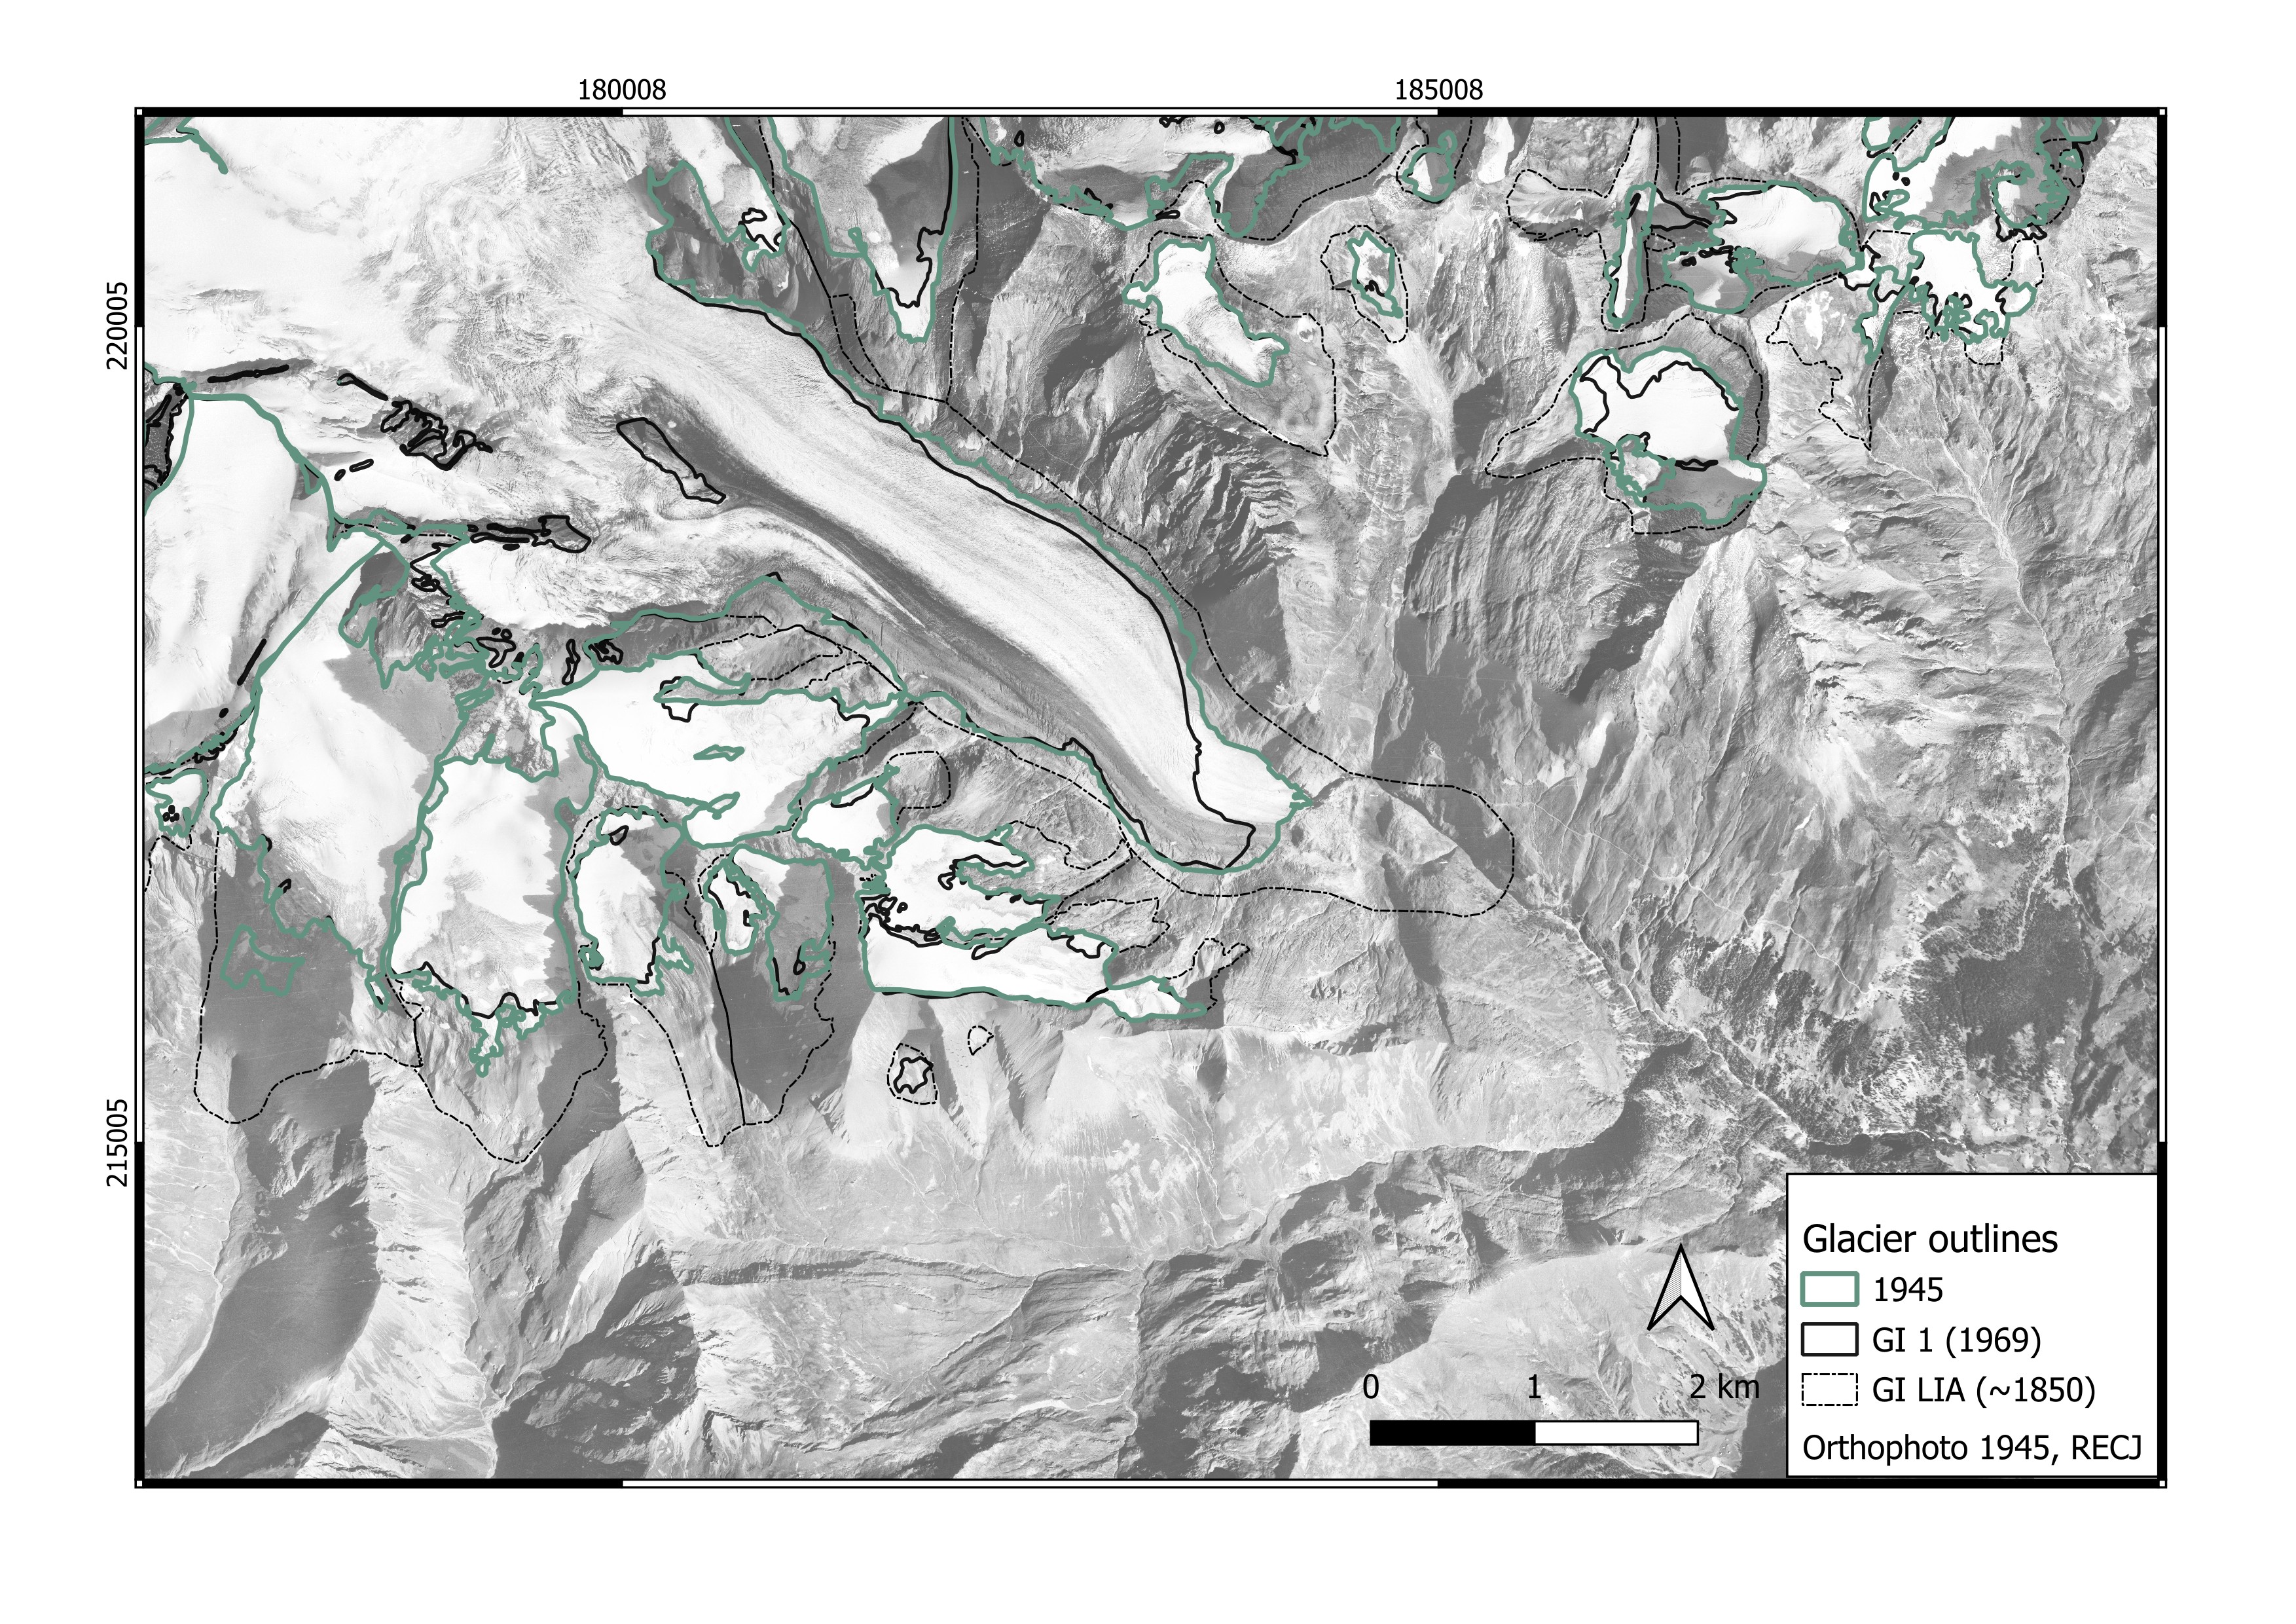
Glacier outlines are delineated from the generated orthophotos using a semi-automated region-growing approach, supported by the corresponding DEMs of difference. Starting from the GI1 (1969) outline of the Austrian glacier inventory, the outline is grown into neighboring pixel as long as a brightness criterion for snow- and ice-covered surfaces was fulfilled, i.e. pixel values above the 80th percentile of the orthophoto brightness within the area of interest. The outlines were visually validated and corrected manually where necessary, which led to satisfying results.
Okt, 2026
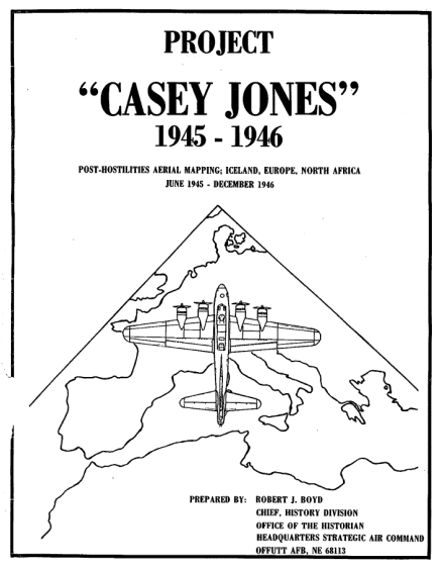
Recovery - Casey Jones
jakob.abermann@uni-graz.at
This project is funded by Land Tirol, Salzburg, Kärnten, Oberösterreich, University of Graz & Innsbruck and the IMC.